FastSTAT Configuration
Configuration
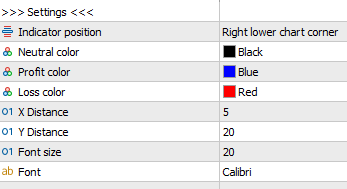
Indicator Position
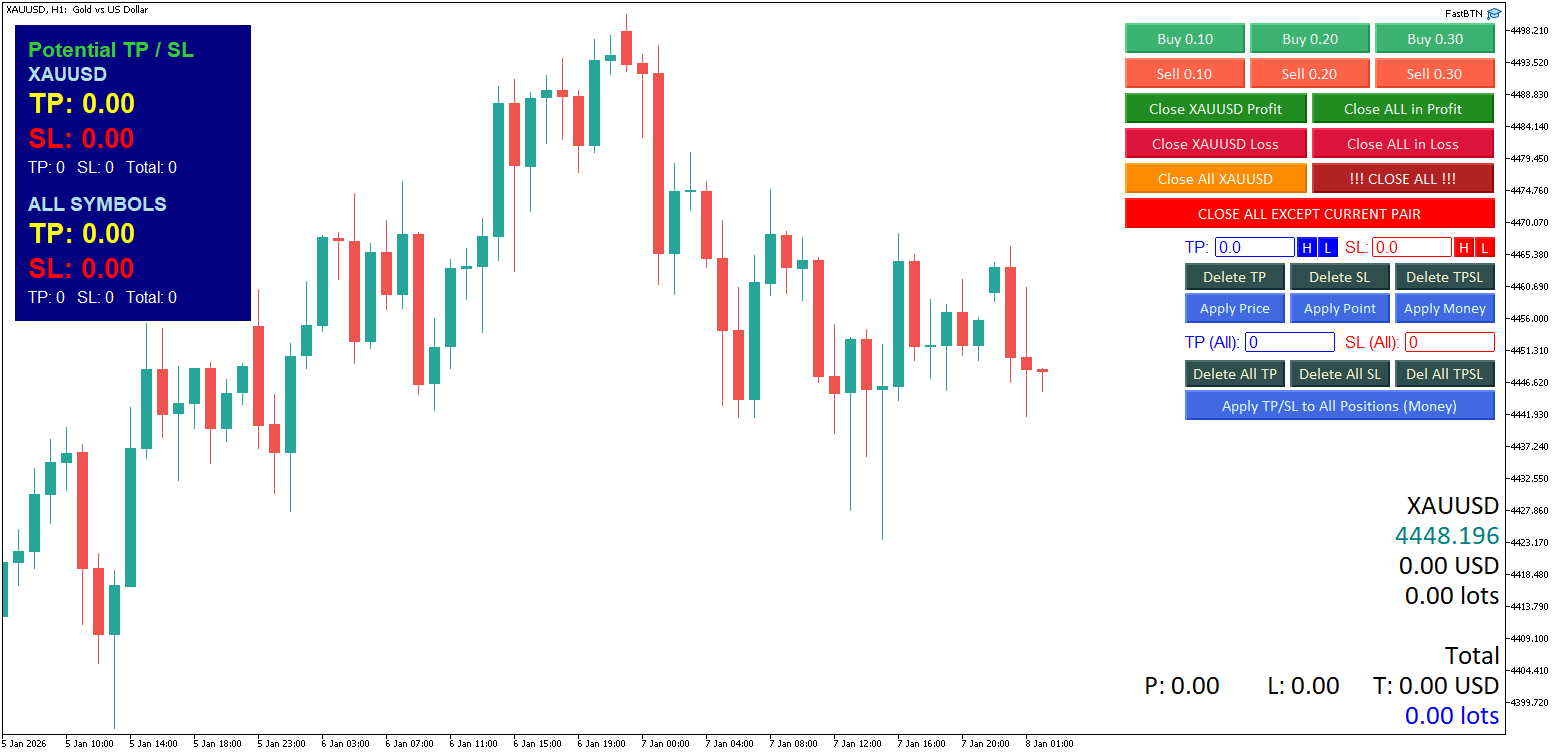
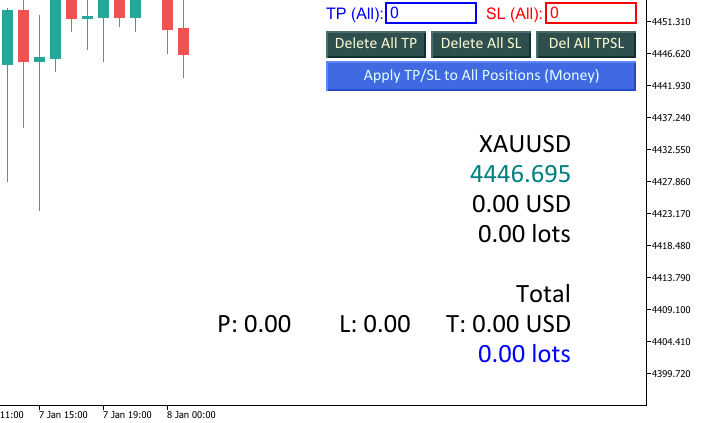
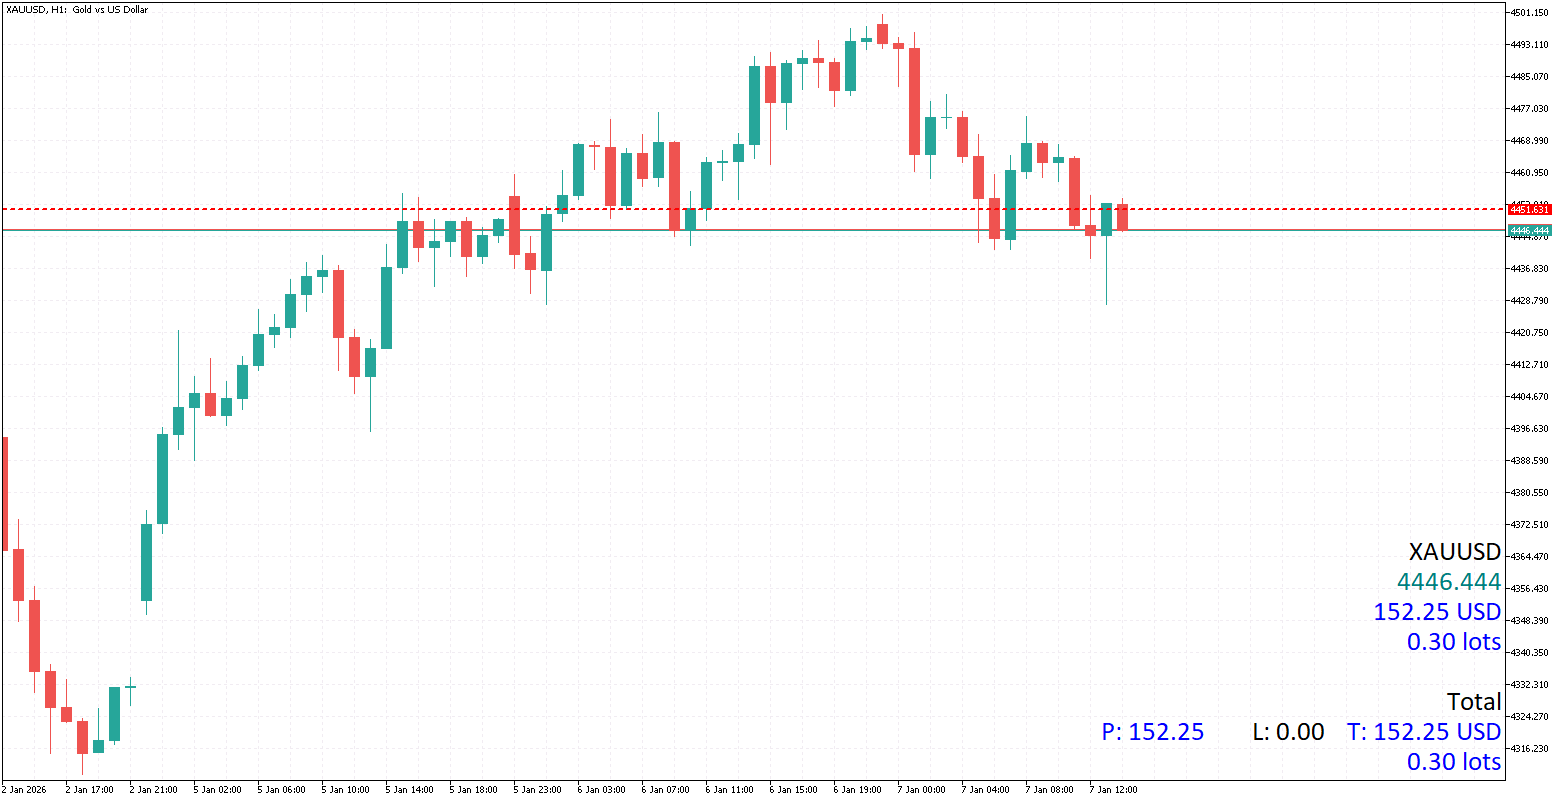
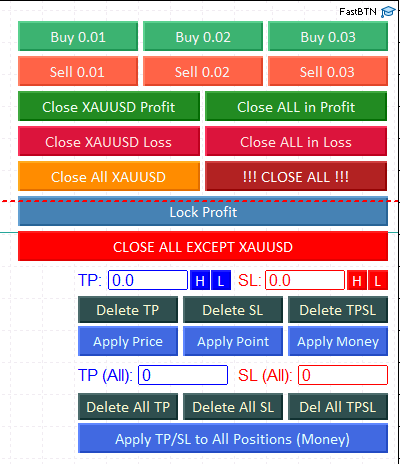
You can choose one of the four chart corners to place FastStat. Personally, I like to place it at the Right lower chart corner, combined with FastBTN like this:
Neutral Color, Profit Color, and Loss Color
- Neutral Color (default:
Black) is used for zero (0) values. - Profit Color (default:
Blue) is used for positive values (profit). - Loss Color (default:
Red) is used for negative values (loss).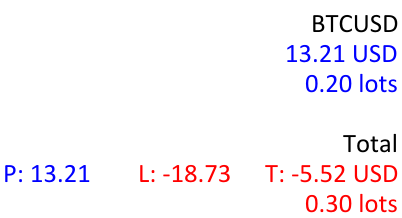
Distance
X Distance
If you set the indicator position to Right lower chart corner or Right upper chart corner, this value represents the distance between the right edge of the indicator and the right edge of the chart.
If you set the indicator position to Left lower chart corner or Left upper chart corner, this value represents the distance between the left edge of the indicator and the left edge of the chart.
Y Distance
If you set the indicator position to Right lower chart corner or Left lower chart corner, this value represents the distance between the bottom of the indicator and the bottom of the chart.
If you set the indicator position to Right upper chart corner or Left upper chart corner, this value represents the distance between the top of the indicator and the top of the chart.
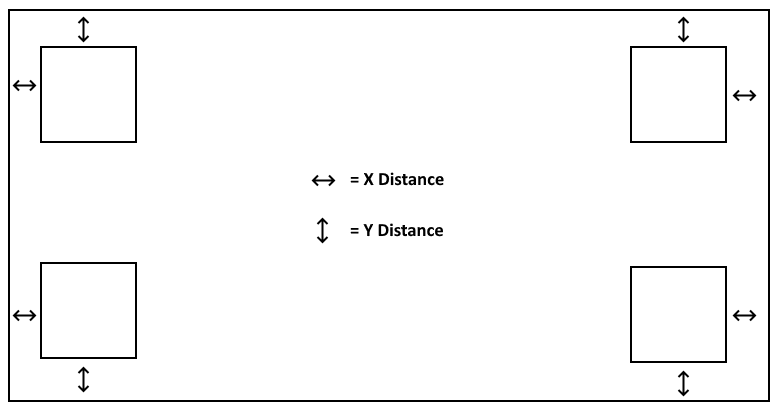
For example, in the image below, I set the indicator position to Right lower chart corner and set the X Distance to 75 and Y Distance to 50.
Font Size and Font Family
Just like in FastBTN, you can change the font size and font family. Make sure you have the font family installed on your computer.
Current Pair & Total (All Pairs)
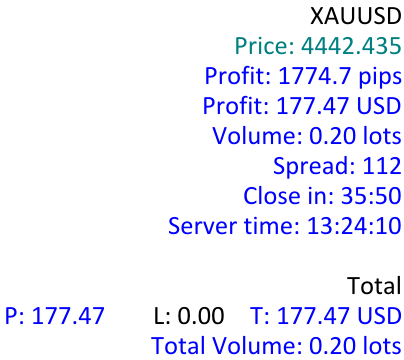
There are 13 pieces of information that you can display on your chart, and you can choose which ones to show or hide.
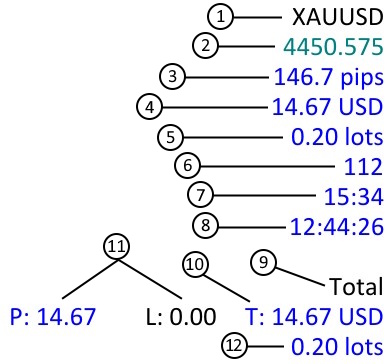
Numbers 1 to 8 are for the current pair only, numbers 9 to 12 are for all pairs:
- Show Symbol
Set this totrueif you want to display the chart’s symbol. This is useful for easily identifying which pair you’re viewing when you have many charts open. - Show Price
Displays the current pair’s price. If you’re like me, I don’t show MT5’s quick trading buttons on the chart anymore since I already use FastBTN, and looking at the price on the right of chart hurts my eyes, then this is very useful. You can choose which price to show: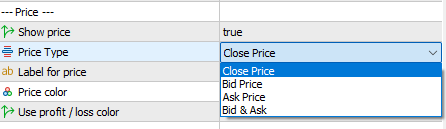
- Close price
- Bid price
- Ask price
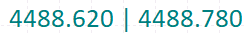
- Bid & Ask price (default). It will shown in this format: Bid_Price | Ask_Price like this:
- Show Profit in Pips
Displays total profit or loss in pips for the current pair.This shows the sum of pips per position, not lot-weighted pips. If you have mixed volumes, it may seem “off” or inconsistent compared to profit/loss in money. - Show Profit in Currency
Displays total profit or loss in money amount for the current pair. - Show Volume
Displays total volume opened for the current pair. - Show Spread
Displays the spread for the current pair. - Show Time to Bar Closure
Shows how long until the next bar/candlestick appears. - Server Time
Displays the server’s current time. - Title
You can change what to display as the title, such as “Total” or “All”, etc. - Show Total Profit of All Open Positions
Displays the total profit (or loss) in money amount for all open positions. No option to show this in pips is available. - Show Profit & Loss of All Open Positions
These will only be shown ifShow total profit of all open positionsis set totrue.
It will display:
• The sum of profits in money amount from profitable positions on all pairs. It starts with P:
• The sum of losses in money amount from losing positions on all pairs. It starts with L: - Show Total Volume of All Open Positions
Displays total volume for all open positions on all pairs.
Modify Appearance
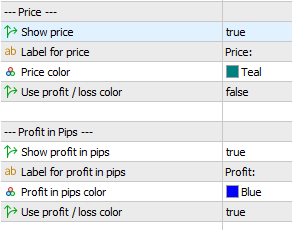
Use Labels
Except for items number 1, 10, and 11 (see the screenshot above), you can use a label for each item like this:
Leave an item’s label property blank if you don’t want to use it.
Change Color
 You can change each item’s color except for Profit only and Loss only for all open positions and Total profit / loss for all open positions (items number 10 and 11 in the screenshot above). They will use Neutral Color, Profit Color, and Loss Color.
If you set an item’s Use profit / loss color property to true, then that item will also use Neutral Color, Profit Color, and Loss Color.
BEP Line
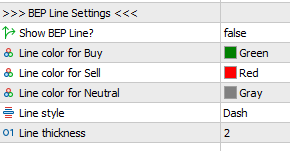
Setting Show BEP Line to true will display a line at the Break Even Price.
Line Color for Buy
This is the color shown if:
- You have Buy positions only.
- You have mixed positions (Buy & Sell) where the number of Buy positions exceeds the number of Sell positions.
Line Color for Sell
This is the color shown if:
- You have Sell positions only.
- You have mixed positions (Buy & Sell) where the number of Sell positions exceeds the number of Buy positions.
Line Color for Neutral
This is the color shown if you have mixed positions (Buy & Sell) where the number of Buy positions is the same as the number of Sell positions.
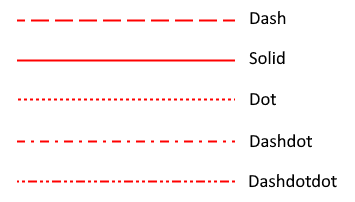
Line Style
There are 5 options for the line style:
Line Thickness
The default value is 2. You can increase it to make the line thicker and more visible.
BEP Line Blocking FastBTN
If the BEP Line appears in front of FastBTN like this:
That means you loaded FastStat after FastBTN.
Simply remove FastBTN from your chart and then reload it. The last loaded indicator / EA will appear in front of previously loaded ones.
Refresh Behavior
FastSTAT updates automatically when:
- Price changes
- Positions are opened or closed
- Market conditions update
No manual refresh is required.